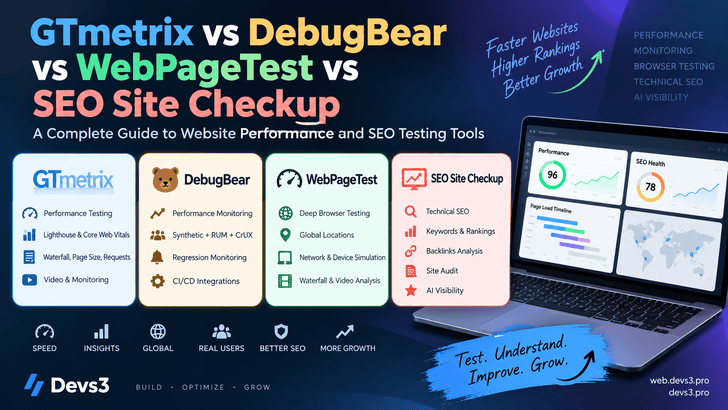
Website performance is no longer just a technical concern. Page speed, Core Web Vitals, server response time, JavaScript execution, mobile performance, technical SEO, backlinks, and even visibility inside AI-powered search experiences can influence how successful a website becomes.
Developers and website owners therefore need more than a simple “speed score.” They need tools that can answer questions such as:
Why is this page slow?
Which resource is delaying the page?
How does the website perform for users in different countries?
Are real visitors experiencing the same performance problems seen in laboratory tests?
Did the latest deployment make the website slower?
Does the website have technical SEO problems?
How visible is the website to search engines and AI systems?
Four platforms frequently used to answer these questions are:
Platform
Primary Focus
Main Capabilities
GTmetrix
Performance Testing
Lighthouse, Web Vitals, waterfall analysis, page size, requests, video and monitoring
Synthetic monitoring, RUM, CrUX, Lighthouse and regression monitoring
WebPageTest
Deep Browser Testing
Browser testing, global locations, network/device simulation, waterfall and video analysis
SEO Site Checkup
SEO Intelligence
Technical SEO, rankings, backlinks, site auditing and AI visibility
Although these platforms overlap in some areas, they are designed around different problems.
GTmetrix is primarily useful for quickly diagnosing page-speed problems.
DebugBear focuses heavily on continuously monitoring performance and detecting regressions.
WebPageTest provides extremely detailed browser and network-level performance investigation.
SEO Site Checkup approaches the website from the SEO and search-visibility perspective.
Understanding those differences is important when deciding which tool—or combination of tools—should be part of your workflow.
1. GTmetrix
What Is GTmetrix?
GTmetrix is one of the best-known website performance testing platforms.
You provide a URL, GTmetrix loads the page in a controlled browser environment and generates a detailed performance report.
Modern GTmetrix reports combine Lighthouse-based analysis with additional performance information such as waterfalls, request information, page composition and loading visualization.
GTmetrix currently highlights Web Vitals and Lighthouse metrics, real-user Core Web Vitals data from CrUX, speed visualization, optimization opportunities, page size and request analysis.
A real waterfall contains much more information, including request timing, ordering, response details and resource metadata.
GTmetrix says its waterfall can be used to identify slow or broken requests and inspect details such as headers, CDN cache status, IP information, size and domain.
This makes the waterfall extremely valuable when investigating problems involving:
CDN configuration
third-party scripts
advertisements
large images
API latency
JavaScript bundles
fonts
caching
redirect chains
Page Size and Request Analysis
A website may feel slow simply because it downloads too much data or makes too many requests.
GTmetrix provides a breakdown of total page size and the number of requests generated by the page.
Immediately, the developer can see where optimization effort should be concentrated.
Speed Visualization and Video
Numbers do not always explain what users actually see.
GTmetrix therefore provides loading visualization and video playback capabilities.
You can visually inspect how the page changes during loading and determine when meaningful content becomes visible.
This is particularly useful when investigating cases where a page technically loads but users continue looking at a blank or incomplete screen.
GTmetrix Monitoring
GTmetrix is not limited to one-time tests.
Pages can also be tested automatically for historical performance tracking.
GTmetrix currently supports scheduled Daily, Weekly and Monthly testing, historical graphs and email alerts based on configured performance conditions.
This turns GTmetrix from a simple speed-testing utility into a lightweight monitoring platform.
The development team can then investigate what changed.
When Should You Use GTmetrix?
GTmetrix is particularly useful for:
developers debugging slow websites
WordPress optimization
frontend performance analysis
agencies auditing client websites
page-size investigation
third-party script analysis
advertisement performance analysis
monitoring important pages
Its biggest advantage is accessibility: complex performance information is presented in a relatively understandable format.
2. DebugBear
What Is DebugBear?
DebugBear is a website performance monitoring platform designed around continuous performance measurement.
While GTmetrix is often used interactively—test a URL and investigate the result—DebugBear is particularly powerful when you need to monitor performance over days, weeks or months.
DebugBear combines several important types of performance data:
Synthetic Monitoring + Real User Monitoring + Google CrUX + Lighthouse
Its documentation describes scheduled lab tests, CrUX tracking and real-user monitoring as core components of the platform.
Synthetic Monitoring
Synthetic monitoring means repeatedly loading a website under controlled conditions.
For example:
text
Location: Singapore
Device: Mobile
Network: 4G
CPU: Throttled

↓
Load website

↓
Collect metrics

↓
Repeat every scheduled interval
Because the testing environment remains controlled, developers can compare results over time.
DebugBear allows testing from more than 30 locations and supports configuration of mobile/desktop environments, network characteristics and CPU throttling.
This is particularly useful for detecting regressions.
Performance Regression Monitoring
Imagine your website normally has:
text
LCP = 1.7 seconds
A new JavaScript release is deployed.
Performance becomes:
text
LCP = 3.4 seconds
Without monitoring, this change could remain unnoticed for weeks.
With continuous monitoring, a performance system can detect the change quickly.
DebugBear can analyze metric changes, monitor JavaScript bundle sizes, compare pages and locations, and use annotations to correlate deployments or content changes with performance trends.
That makes it particularly attractive to engineering teams operating continuous deployment pipelines.
Real User Monitoring — RUM
Synthetic testing tells you what happens in a controlled environment.
Real User Monitoring tells you what happens to actual visitors.
For example, real users may access your website using:
Testing can involve different browsers, geographic locations, network configurations and advanced browser settings.
WebPageTest also provides page-level and request-level metrics, Core Web Vitals, Speed Index, Lighthouse reports, visual comparisons, filmstrips, video replay and waterfall analysis.
Browser-Based Testing
A major strength of WebPageTest is the ability to observe what actually happens while a browser loads a page.
The testing system can capture detailed information involving:
This makes WebPageTest particularly useful when simple Lighthouse scores do not provide enough information.
Global Testing
Website performance can vary dramatically depending on where the user is located.
Consider a server located in Europe.
A visitor in London might experience:
text
Latency ≈ low
while a visitor in South Asia could experience substantially greater latency depending on routing and CDN architecture.
WebPageTest provides testing across global locations, and its product information describes worldwide locations and browser-based testing environments.
This allows developers to investigate questions such as:
Is the CDN working correctly?
Are assets being served from nearby edge nodes?
Is the origin server too far from important users?
Does the website perform poorly in a particular region?
Network Simulation and Connection Profiles
WebPageTest allows developers to test websites under different connection conditions.
For example:
text
Fast broadband
4G
3G
High latency
Custom bandwidth
The public testing interface exposes different connection profiles and advanced configuration options for browser and network testing.
This is extremely important because testing only from a developer's high-speed office connection can hide serious performance problems.
A page that loads in one second over fast broadband may take several seconds on a slower mobile connection.
WebPageTest Waterfall
WebPageTest is particularly famous for its detailed waterfalls.
A waterfall can help identify:
DNS delays
TCP connection delays
TLS negotiation
TTFB problems
render-blocking CSS
JavaScript dependencies
large images
third-party requests
CDN problems
redirects
API bottlenecks
For advanced performance engineers, this request-level visibility is often more valuable than a single performance score.
Filmstrip and Video Analysis
WebPageTest can capture the visual loading process frame by frame.
Its filmstrip tooling can correlate visual changes with events such as Largest Contentful Paint and layout shifts.
Its current feature set includes technical SEO auditing, ranking analysis, backlink monitoring, domain analysis and AI-oriented content visibility features.
Technical SEO Auditing
Technical SEO problems can prevent search engines from understanding or efficiently crawling a website.
An SEO auditing system may examine areas such as:
text
Title Tags
Meta Descriptions
Headings
Canonical URLs
Robots Directives
Sitemaps
Internal Links
Broken Links
Structured Data
Mobile Compatibility
Performance
SEO Site Checkup currently advertises auditing across more than 70 technical factors.
The objective is not merely to say that a page has a problem, but to organize issues so that developers, marketers and SEO teams can act on them.
Keyword and Rank Tracking
Performance tools ask:
How quickly does the page load?
SEO platforms ask:
Can users find the page?
Rank tracking therefore becomes an important component of an SEO intelligence platform.
Teams can monitor search performance over time and determine whether optimization work corresponds with changes in visibility.
Backlink Analysis
Backlinks remain an important part of understanding a website's authority and external visibility.
SEO Site Checkup's backlink functionality tracks information such as referring domains, link quality, authority signals and new backlink growth.
Conceptually:
text
Website A ─────→ Your Website
Website B ─────→ Your Website
Website C ─────→ Your Website
A backlink system attempts to understand these relationships and help users identify changes in their link profile.
Deep Domain Analysis
Analyzing a single URL is not enough for large websites.
SEO Site Checkup's Deep Domain Analysis is designed to scan a domain and organize SEO performance by page groups, helping users understand which sections are performing well and which sections contain problems.
This is particularly useful for websites containing hundreds or thousands of URLs.
AI Visibility and AI Content Analysis
Search is evolving beyond traditional search-engine results.
Users increasingly discover information through systems such as:
ChatGPT
Gemini
Claude
Perplexity
Copilot
Google AI experiences
SEO Site Checkup has expanded into this area with AI Content Analysis.
Its current platform describes analysis of how systems including ChatGPT, Claude, Gemini, Perplexity, Copilot and AI Overviews interpret website content, along with AI-readiness scoring, content-gap analysis and trust-signal auditing.
This represents an emerging category sometimes described as AI visibility, GEO or generative-engine optimization.
Traditional SEO asks:
text
Can Google discover and rank my content?
AI visibility introduces another question:
text
Can AI systems understand, trust and surface my content?
This area will likely become increasingly important as AI-assisted discovery grows.
Comparing the Four Platforms
These tools should not necessarily be viewed as direct competitors.
They solve overlapping but different problems.
Capability
GTmetrix
DebugBear
WebPageTest
SEO Site Checkup
Lighthouse
Strong
Strong
Strong
Limited/SEO-oriented
Core Web Vitals
Yes
Extensive
Extensive
SEO context
Waterfall
Strong
Strong
Very Detailed
Limited
Video / Filmstrip
Yes
Yes
Advanced
No/Not Primary
Synthetic Monitoring
Yes
Excellent
Available
Not Primary
Real User Monitoring
CrUX-oriented field data
Strong RUM
Available in paid offering
No/Not Primary
CrUX
Yes
Strong
Performance-oriented
Not Primary
Global Testing
Yes
30+ locations
Strong
Not Primary
Network Testing
Yes
Yes
Advanced
Not Primary
Regression Monitoring
Basic/Monitoring
Excellent
Possible through automation
SEO-focused monitoring
Technical SEO
Basic Lighthouse SEO
Basic Lighthouse SEO
Lighthouse
Strong
Backlinks
No
No
No
Yes
Rank Tracking
No
No
No
Yes
AI Visibility
No
Agent/AI-related technical metrics emerging
No/Not Primary
Strong focus
CI/CD
Limited compared with engineering-first platforms
Strong
Strong via API
Not Primary
The exact capabilities and plan limits of these services can change, so teams should verify current pricing and plan-specific features before choosing a production tool.
Which Tool Should You Use?
The answer depends on the problem you are trying to solve.
It is relatively easy to use while still providing enough detail for serious optimization work.
For Continuous Performance Monitoring
Use:
DebugBear
A typical workflow could be:
text
Production Website
        ↓
Synthetic Monitoring
        +
Real User Monitoring
        +
CrUX
        ↓
Performance Dashboard
        ↓
Regression Detection
        ↓
Alert
        ↓
Engineering Investigation
This is particularly valuable for SaaS and frequently deployed web applications.
For Deep Performance Investigation
Use:
WebPageTest
A typical workflow might be:
text
Select Browser
+
Select Location
+
Select Network
+
Configure Test
        ↓
Run Browser
        ↓
Waterfall
+
Filmstrip
+
Video
+
Core Web Vitals
+
Network Timing
        ↓
Root Cause Analysis
This is ideal when you need deeper technical control over the testing environment.
For SEO and Search Visibility
Use:
SEO Site Checkup
The workflow is fundamentally different:
text
Website
↓
Crawler / SEO Analysis
↓
Technical SEO
+
Rankings
+
Backlinks
+
Content Analysis
+
AI Visibility
↓
SEO Recommendations
This makes it more relevant to SEO specialists, content teams, agencies and marketers.
A Better Strategy: Use Multiple Layers
For important websites, relying on only one tool is rarely ideal.
A more complete website-quality stack could look like:
text
                    WEBSITE
                       │
        ┌──────────────┼──────────────┐
        │              │              │
   Performance     Monitoring        SEO
        │              │              │
    GTmetrix        DebugBear    SEO Site Checkup
        │              │              │
        └────── WebPageTest ──────────┘
                 Deep Analysis
Each platform answers a different question.
GTmetrix: Why is this page slow?
DebugBear: Is the website getting slower over time, and are real users affected?
WebPageTest: Exactly what happened inside the browser and network while this page loaded?
SEO Site Checkup: What is preventing the website from achieving stronger search and AI visibility?
Together, these perspectives provide a much more complete understanding of website quality.
Example: Diagnosing a Slow Ecommerce Website
Suppose an ecommerce website receives complaints about slow product pages.
GTmetrix might reveal:
text
Page Size: 6.2 MB
Requests: 142
LCP: Slow
JavaScript: Heavy
The development team now knows there is a problem.
Next, WebPageTest might reveal:
text
Hero Image → 1.8 MB
Analytics → delayed
Ad Script → blocking
API → 900 ms TTFB
Third-party JS → heavy CPU execution
Now the technical causes are clearer.
DebugBear can then be configured to monitor the optimized page continuously.
text
Before optimization:
LCP = 4.1s

After optimization:
LCP = 2.0s
If a future deployment pushes LCP back above the team's performance budget, an alert can be generated.
Finally, SEO Site Checkup can investigate whether product pages also contain search-related issues involving metadata, internal links, technical SEO, backlinks or content visibility.
The four tools therefore become parts of a larger website optimization lifecycle rather than isolated utilities.
Understanding Synthetic, RUM and CrUX Data
One of the most important concepts when working with performance tools is understanding the difference between synthetic and real-world data.
Synthetic Testing
A controlled browser environment generates a test.